Pay gaps and workforce representation report: December 2022
This report provides information on our gender and ethnicity representation, and the pay gaps that exist. This report will be updated annually.
On this page
Summary
As with all small organisations, even small staffing changes can impact our pay gap statistics. The main driver of our gender pay gap is an overrepresentation of women in lower paid roles. The main driver of our ethnicity gap is an underrepresentation of Māori, Pacific, and other ethnic minorities in higher paid roles and in leadership.
We can clearly see opportunities that could create the most positive change are:
- increasing the representation of Māori, Pacific and other ethnic minorities in our workforce and our leadership
- improving our recruitment and remuneration processes to eliminate bias and increase transparency
- improving our systems for data collection and recording.
About this report
The data includes both permanent and fixed-term employees and is as of December 2022. This report was used to guide the development of our pay equity action plan, published April 2023.
Kia Toipoto – The Public Service Pay Gaps Action Plan(external link)
Our people
Total employees: 162
|
Employment Status |
Women | Men | Not Disclosed |
|---|---|---|---|
| Permanent | 95 | 47 | 1 |
| Fixed-term | 12 | 7 | |
| Full-time | 96 | 52 | 1 |
| Part-time | 11 | 2 |
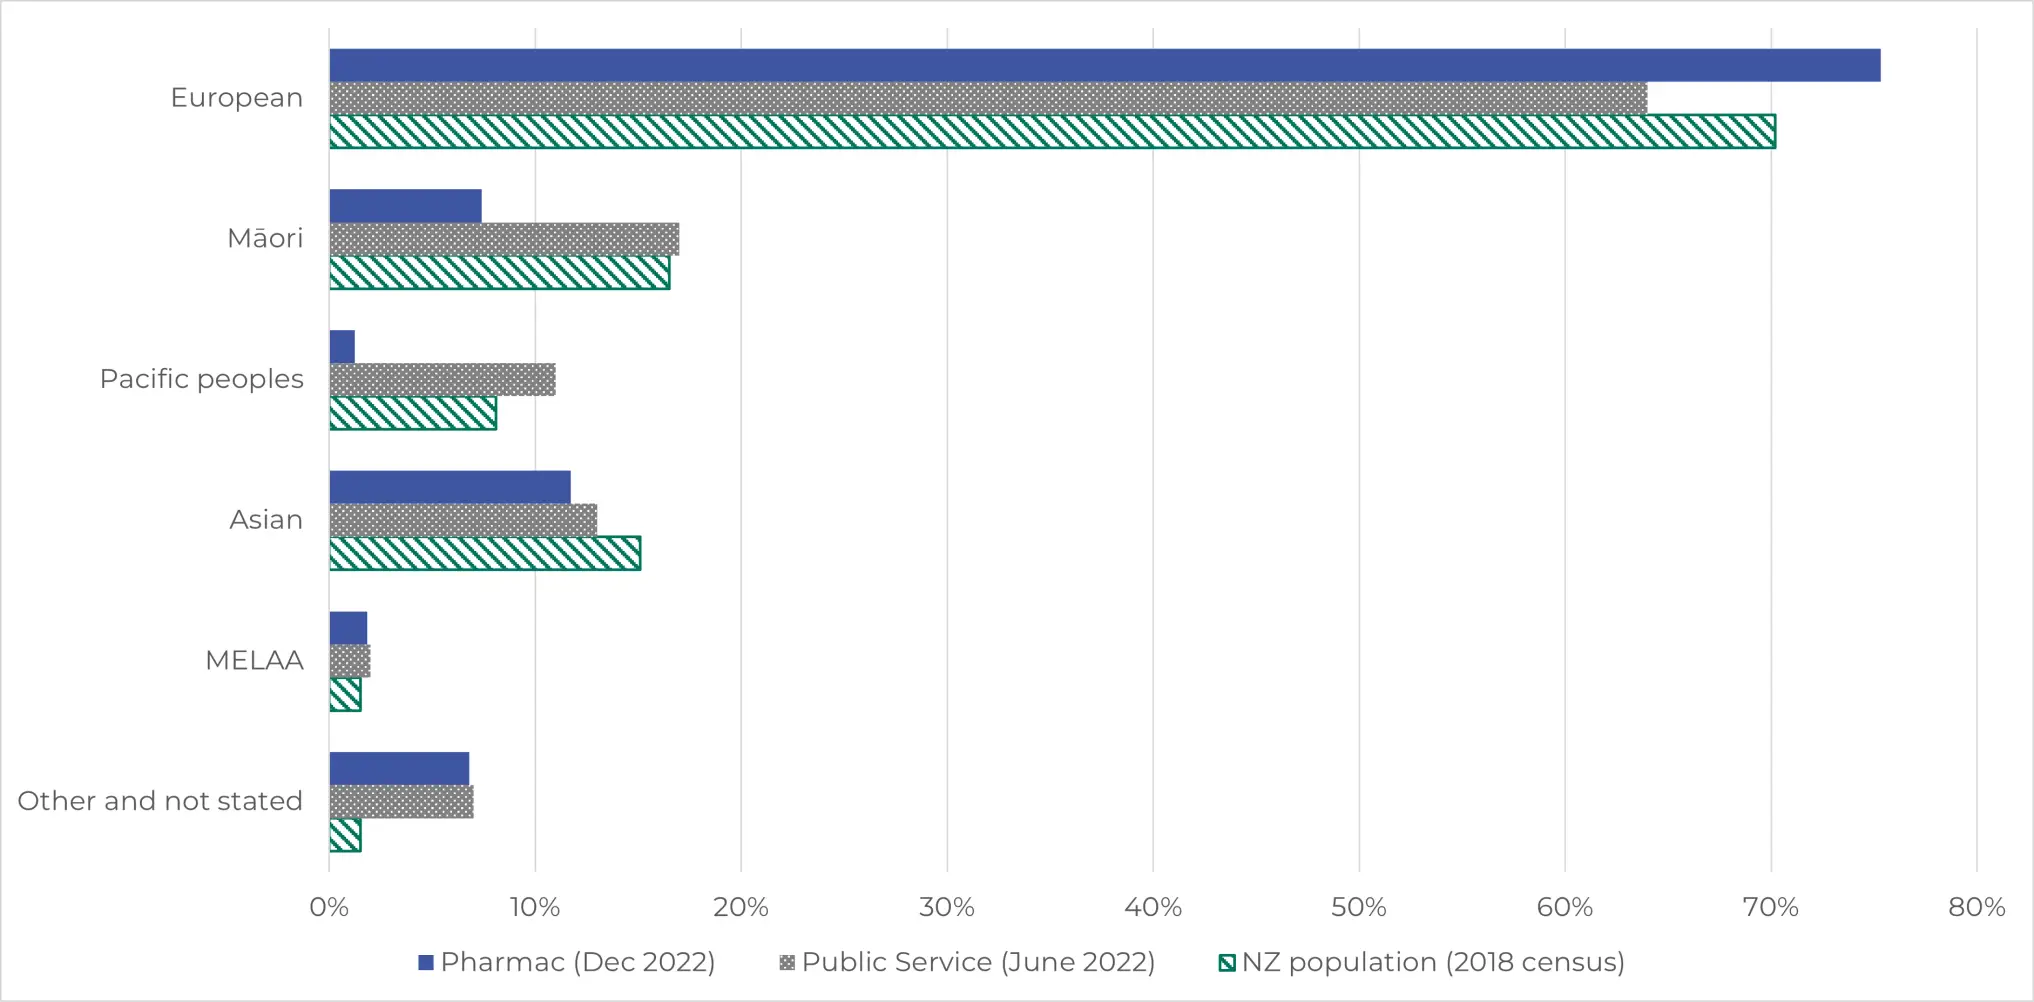
Pharmac ethnicity
We have a 93% ethnicity declaration rate; however, system limitations have restricted most staff to declaring only one or two ethnicities. We have used a total response reporting method. This means people can appear more than once in our reporting, so ethnic group totals will add up to more than 100 percent of staff.
Pay gaps
We calculate pay gaps as recommended by Te Kawa Mataaho Public Service Commission, the % difference in the average hourly pay for women and men using full-time-equivalent total remuneration.
Although we performed a thorough review of our pay equity, due to our small size, we are only able to report our gender and non-European/European ethnicity pay gaps.
Our Gender Pay Gap (GPG) is 10% | Our adjusted GPG for similar roles is 3.5%
Our ethnicity pay gap for Non-Europeans/Europeans is 17%
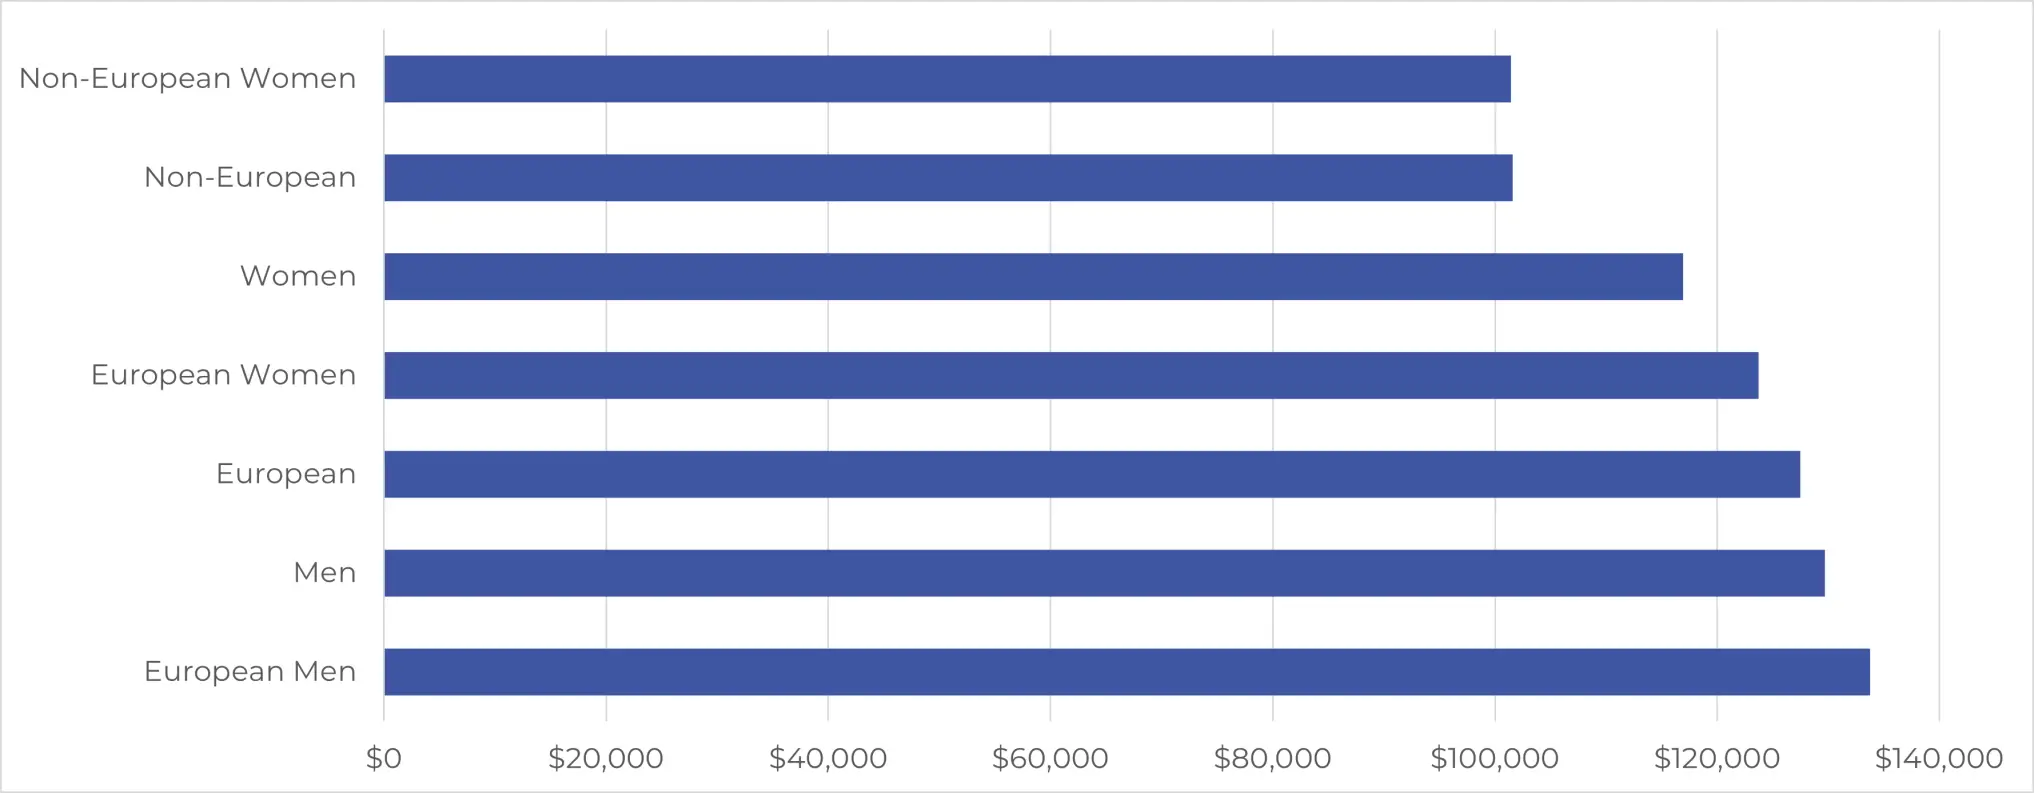
Average salary by gender and ethnicity
Due to small numbers some gender and ethnicity groups have been aggregated, including Māori, Pacific peoples and Non-European men.
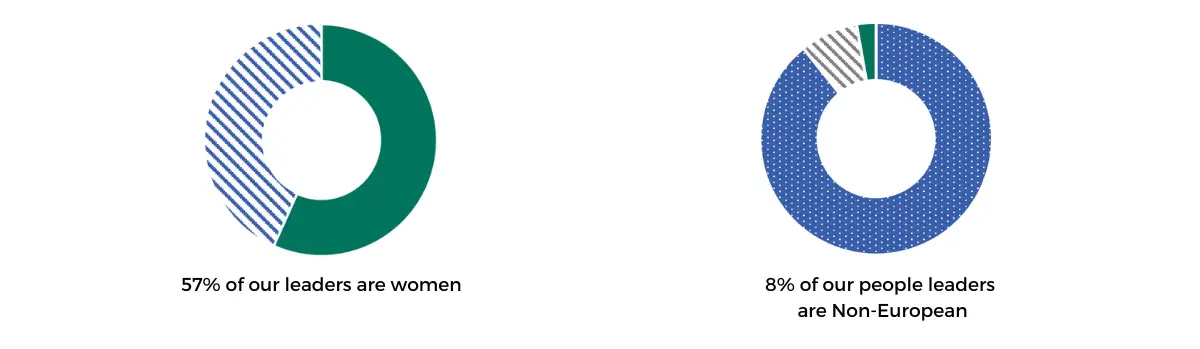
Representation in leadership
3% of people leaders did not declare an ethnicity.